
Guide #
Analytics #
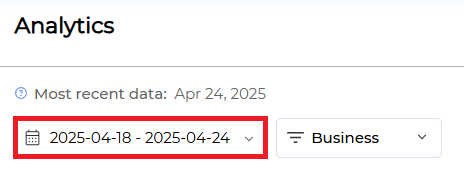
- Select the date to view the statistical information.
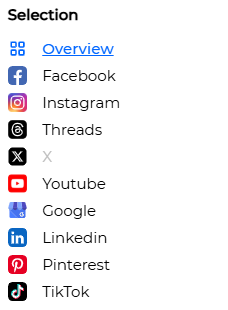
- In the Selection area on the right, select the social media for which you want to check the statistical information. Refer to Statistics by Social Media below for the retrieved statistical information.
Caution #
It will be deactivated if there is no connected social media.
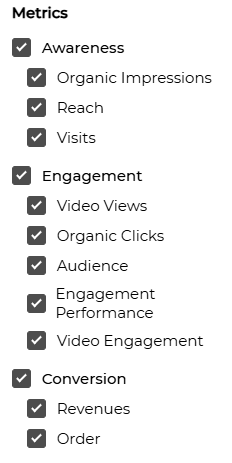
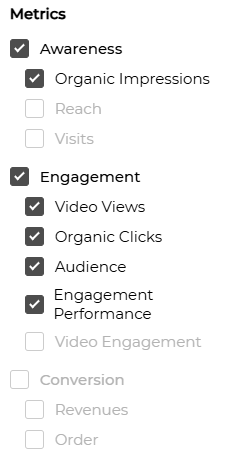
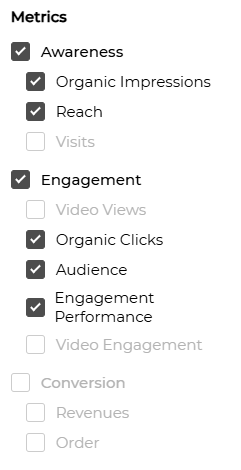
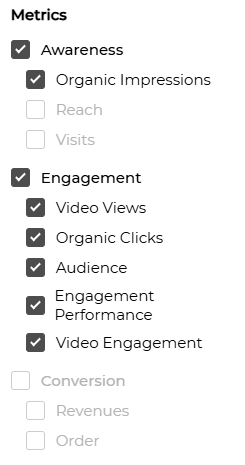
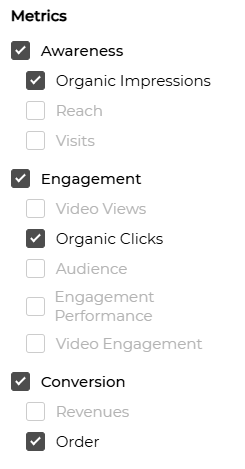
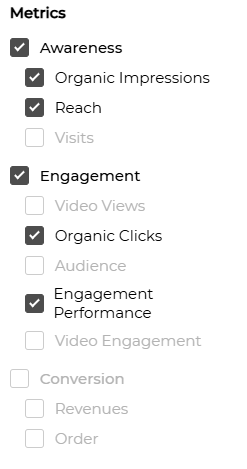
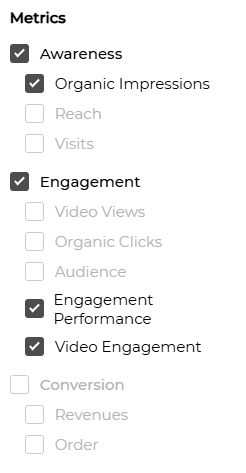
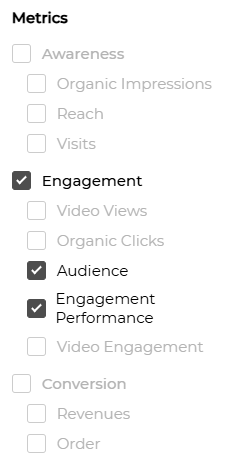
Currently, X does not provide statistical information. - In the Metrics area, select the statistical information you want to check. Only statistical information available for each social media platform can be selected.
Caution #
LikeIT Social can only view statistical information up to 3 days prior to today’s date. Statistical information cannot be provided because the date for providing statistical information differs for each social media platform.
Statistics by Social Media #
1. Overview #
Summarizes and shows the overall social media activity of the business account at a glance during the selected period.
In the Overview, you can check the following key indicators:
Post Activity #
- Total Post: Displays the total number of posts published on each social media platform (e.g., Facebook, Instagram, LinkedIn, etc.) during the set period.
- Social media distribution: A donut chart showing the percentage of published posts by platform. You can easily see which platform has more posts.
- Total Post over time: A graph showing the change in the number of posts by date during the selected period. You can identify trends where posts are concentrated on specific dates.
Audience #
- Total Audience: Shows the number of followers (subscribers) of each social media account.
- Social media distribution: A donut chart showing the percentage of followers by platform out of the total followers.
- Total Audience Over Time: A graph showing the change in the number of followers (subscribers) by date during the selected period.
Impressions #
- Total Impressions: Aggregates the total number of times the post was exposed to the user’s screen.
- Social media distribution: A donut chart dividing the occurrence rate of impressions by platform.
- Total Impressions over time: A graph showing how the number of impressions has changed by date.
Engagement #
- Total Engagement: Shows the total number of interactions (likes, comments, shares, etc.) on the post.
- Social media distribution: A donut chart showing the percentage of total engagement by platform.
- Total Engagement over time: Shows the trend of the number of engagements changing by date.
2. Facebook #
Selectable Metrics are as follows.
- Awareness
- Engagement
Organic Impressions #
- Posts Impressions: Total number of times all posts were shown to users.
Video Views #
- Post Video Views Organic: Total number of times the post video was played naturally without paid advertising.
Organic Clicks #
- Posts Likes: Number of “likes” pressed on the post.
Audience #
- Page Fans: Total number of users who currently “like” (subscribe to) the page.
- Page Fans Add: Number of users who newly “liked” the page during a specific period.
- Page Fans Remove: Number of users who canceled “liking” the page during a specific period.
Engagement Performance #
- Engagement: Number of user interactions (including likes, comments, shares) on the post.
- Page Total Actions: Sum of all actions that occurred within the page (e.g., making a phone call, clicking a link, etc.).
- Page Content Activity: Records of all activities (views, clicks, reactions, etc.) on posts within the page.
- Page Consumption: Total number of times content (posts, photos, videos, etc.) was clicked, played, or read by users.
3. Instagram #
Selectable Metrics are as follows.
- Awareness
- Engagement
Organic Impressions #
- Posts Impressions: Total number of times all posts were shown to users.
Reach #
- Reached Users: Number of individual users who actually viewed the content.
Organic Clicks #
- Total click over time: Graph of changes in the number of clicks over time.
- Total click: Total number of clicks that occurred within the period.
- Click by type (%): Distribution of the number of clicks by click type (e.g., website click, profile visit, phone call, etc.).
Audience #
- Total Audience: Total number of unique users contacted during a specific period.
- Audience by country (%): Distribution status of users by country.
Engagement Performance #
- Total Engagement over time: Graph of changes in the total number of engagements(likes, comments, etc.) over time.
- Total Engagement: Sum of all engagement activities that occurred within the period.
- Engagement by type: Distribution of the number of engagements by engagement type(likes, comments, saves, etc.).
4. Threads #
Selectable Metrics are as follows:

- Engagement
Audience #
- Profile Views: Number of times the profile page was visited
Engagement Performance #
- Total Engagement over time: Graph of changes in the total number of engagements(likes, comments, etc.) over time.
- Total Engagement: Sum of all engagement activities that occurred within the period.
- Engagement by type: Distribution of the number of engagements by engagement type(likes, comments, saves, etc.).
5. X #
Currently not supported.
6. Youtube #
Selectable Metrics are as follows:
- Awareness
- Engagement
Organic Impressions #
- Card Impressions: Number of times cards (links or interactive elements) used within the video were shown to the user.
- Annotation Impressions: Number of times annotations (text or clickable links) shown in the video were exposed.
- Card Teaser Impressions: Number of times YouTube displayed a teaser message encouraging the user to click on a card.
Video Views #
- Video Views: Number of times users clicked and watched the video.
Organic Clicks #
- Organic Reactions By Type (%): Metrics categorized by the type of organically generated reaction.
- Likes: Number of times users pressed “like” for the video.
- Dislikes: Number of times users pressed “dislike” for the video.
- Comments: Number of comments users left on the video.
- Shares: Number of times users shared the video with others.
- Cards Clicks: Number of times cards (links or recommended videos) inserted into the video were clicked.
Audience #
- Subscribers: Number of users who subscribed to the channel.
Engagement Performance #
- Total Engagement: Sum of all engagement activities that occurred within the period.
- Estimated Minutes Watched: Estimated total time the video was watched.
- Average Time in Playlist: Metric showing how long users watched the video on average within a playlist.
Video Engagement #
- Videos Added / Removed: Number of videos added or removed from the playlist.
7. Google #
Selectable Metrics are as follows:
- Awareness
- Engagement
- Conversion
Organic Impressions #
- Total Impressions over time: Metric tracking the total number of impressions over a specific period, broken down by time units.
- Total Impressions: Total number of times content or ads were displayed from all sources, including paid ads.
- Impression by type (%): Metric categorizing what type of content or ad caused the impression.
Organic Clicks #
- Total click over time: Graph showing the trend of changes in the number of clicks over time.
- Total click: Total number of clicks that occurred within the period.
- Click by type: Distribution of the number of clicks by click type (e.g., website click, profile visit, phone call, etc.).
Order #
- Food orders: Number of food orders placed within the selected period.
8. LinkedIn #
Selectable Metrics are as follows:
- Awareness
- Engagement
Organic Impressions #
- Impression amount: Total number of times content or ads were displayed on the user’s screen.
Reach #
- Views: Number of times users viewed the content.
Organic Clicks #
- Clicks: Total number of times content or links were clicked.
- Activity by type (%): Metric tracking various activities with which users interacted with the content.
- Likes: Number of times users pressed “like” for the content.
- Comments: Number of comments users left on the content.
- Shares: Number of times users shared the content with others.
Engagement Performance #
- Engagement: Metric including all user interactions related to the content.
9. Pinterest #
Selectable Metrics are as follows:
- Awareness
- Engagement
Organic Impressions #
- Total Impression: Total number of times content or ads were displayed on the user’s screen.
Engagement Performance #
- Total Engagement: Sum of all forms of user interactions with the content.
- Engagement rate: Ratio of total engagement with the content divided by the number of times the content was exposed. Generally calculated as (Number of Engagements ÷ Number of Impressions) × 100.
- Actions: Total number of all actions users took on the content.
- Actions by type: Metric dividing the actions users took on the content by type.
Video Engagement #
- Video watched performance: Metric measuring how often video content was watched and how much viewers engaged.
- Average watched time (min): Average time users watched the video.
- Total time watched (min): Total time all users watched the video.
10. Tiktok #
Selectable Metrics are as follows:
- Engagement
Audience #
- Follower count: Total number of users currently following the page.
Engagement Performance #
- Likes count: Number of times users pressed “like” for the content.
Download #
Please click the More icon at the top right of the statistics information.
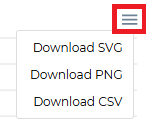
Click the file type you want to download.
Supported file types: SVG, PNG, CSV