
1. Sales Insight #
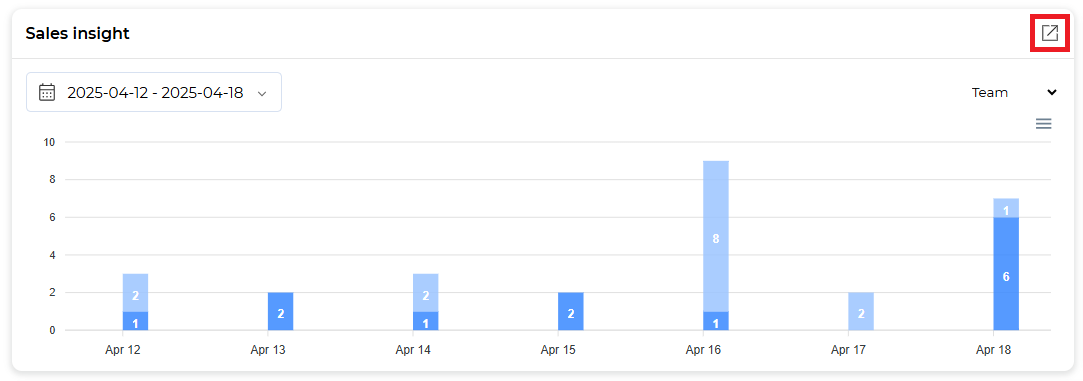
- Function: A graph visualizing the number of contracts closed by the team during the selected period.
- Usage:
- Select Date Range: You can specify the inquiry period by clicking the calendar icon.
- Team/Representative Filter: Filter by the responsible employee or team.
- Clicking the shortcut icon will take you to the Sales Analytics screen.
2. Contracts #
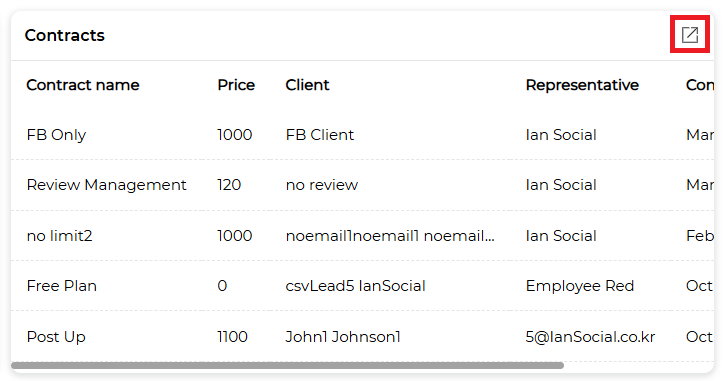
- Function: Displays recent contract information in list form.
- Items:
- Contract name
- Price
- Client
- Representative
- Contract Date
- Usage:
- This list displays the 5 most recent contracts. Clicking the contract name will take you to the corresponding contract details screen.
- Clicking the shortcut icon will take you to the Contract List screen.
3. Leads #
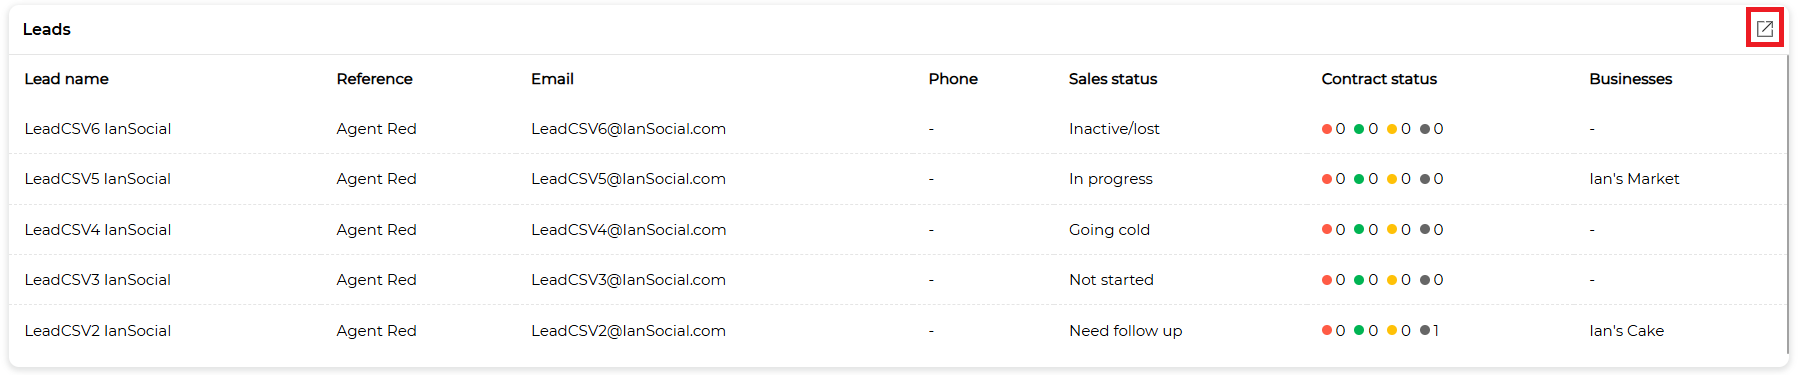
- Function: Check the status of leads (potential customers) currently in sales.
- Items:
- Lead name
- Reference
- Phone
- Sales status
- Contract status
- Businesses
- Usage:
- This list displays the 5 most recently created leads. Clicking a lead will take you to the corresponding lead profile screen.
- Clicking the shortcut icon will take you to the Lead List screen.
4. Sales analytics #
This is a dashboard where you can visualize and check sales performance by period. It is used to track and analyze the performance of the sales team’s activities.
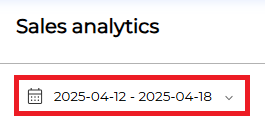
To change the date, please click the calendar icon.
This page is composed of a total of 3 sections.
1. Total number of leads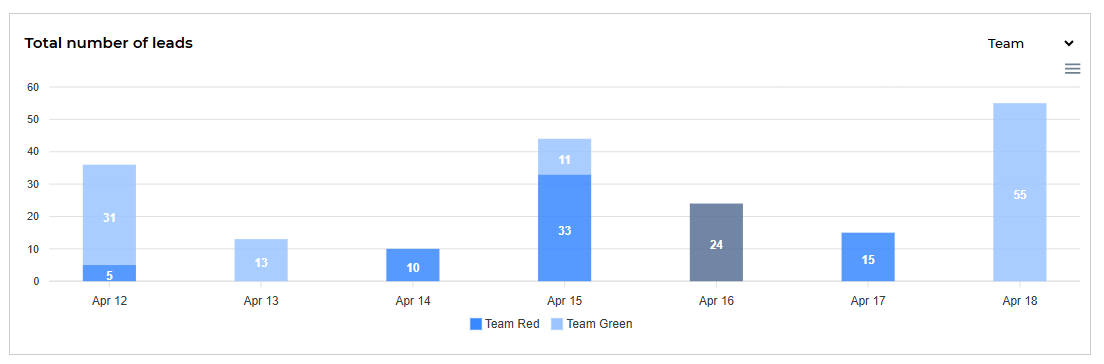 #
#
- Shows the number of leads created in a graph by date.
- At the bottom, the team or representative color legend that created the leads is displayed.
- Each dot represents the number of leads created on that date.
2. Total number of completed contracts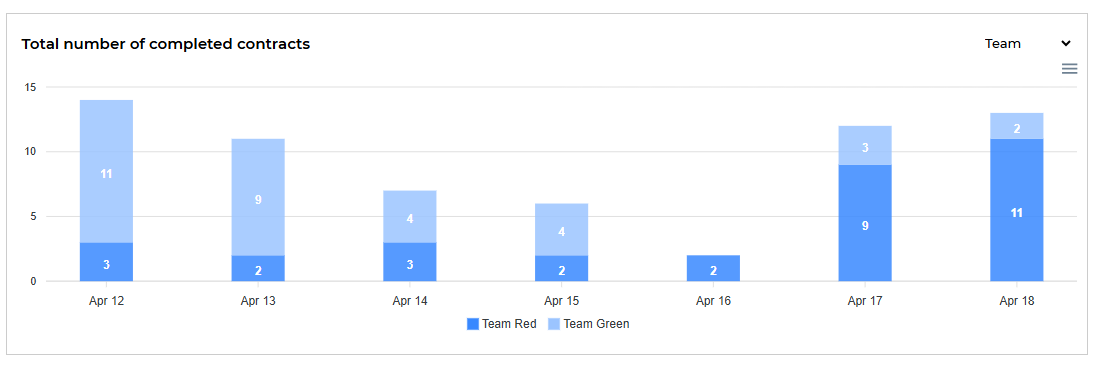 #
#
- This is a graph where you can check the number of completed contracts by date.
- The completion criteria is the point in time when the contract status is changed to “Completed”.
- Separate colors by team or employee are displayed.
3. Number of clients by contract price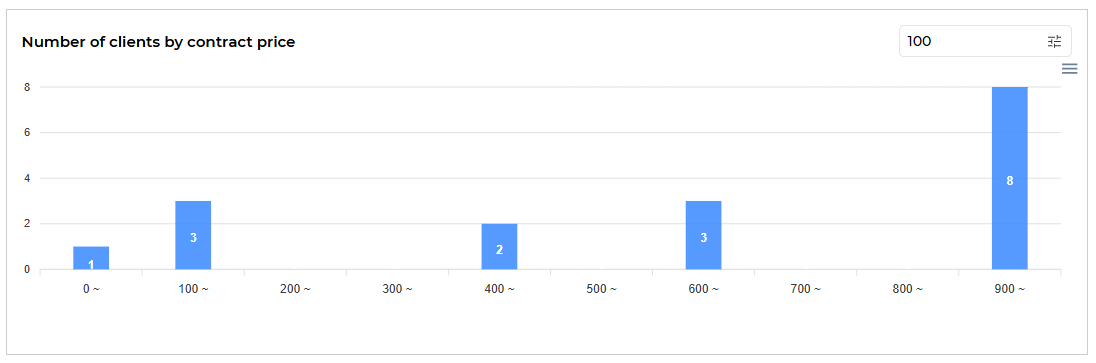 #
#
- Aggregates the number of customers by contract amount and expresses it as a bar graph.
- The number in the upper right corner indicates the selected amount range (e.g., $100 units).
- The height of the bar represents the number of customers who contracted in the price range.